On this page
The short version
- Currency strength meters compress many pair moves into one score per currency, in two families: price-based and fundamental-based.
- The U.S. Dollar Index, published by ICE, weights the euro at 57.6% — so USD strength readings anchored to it are largely an EUR/USD story.
- Sign conventions and basket weights, not just prices, decide a meter's output; two meters can disagree on the same market.
- A meter is backward-looking and not a tradable instrument, an entry signal, or broker research — check each pair's own costs and timing separately.
Currency strength meters promise a single glance at the whole forex market: instead of watching dozens of pairs separately, you see which currencies are strong and which are weak right now. That is genuinely useful information — pair moves are always relative, so knowing why a pair moved matters. But how these meters are built, and what their numbers can and cannot tell you, is less obvious than the tidy bars on the screen suggest.
What a currency strength meter actually measures
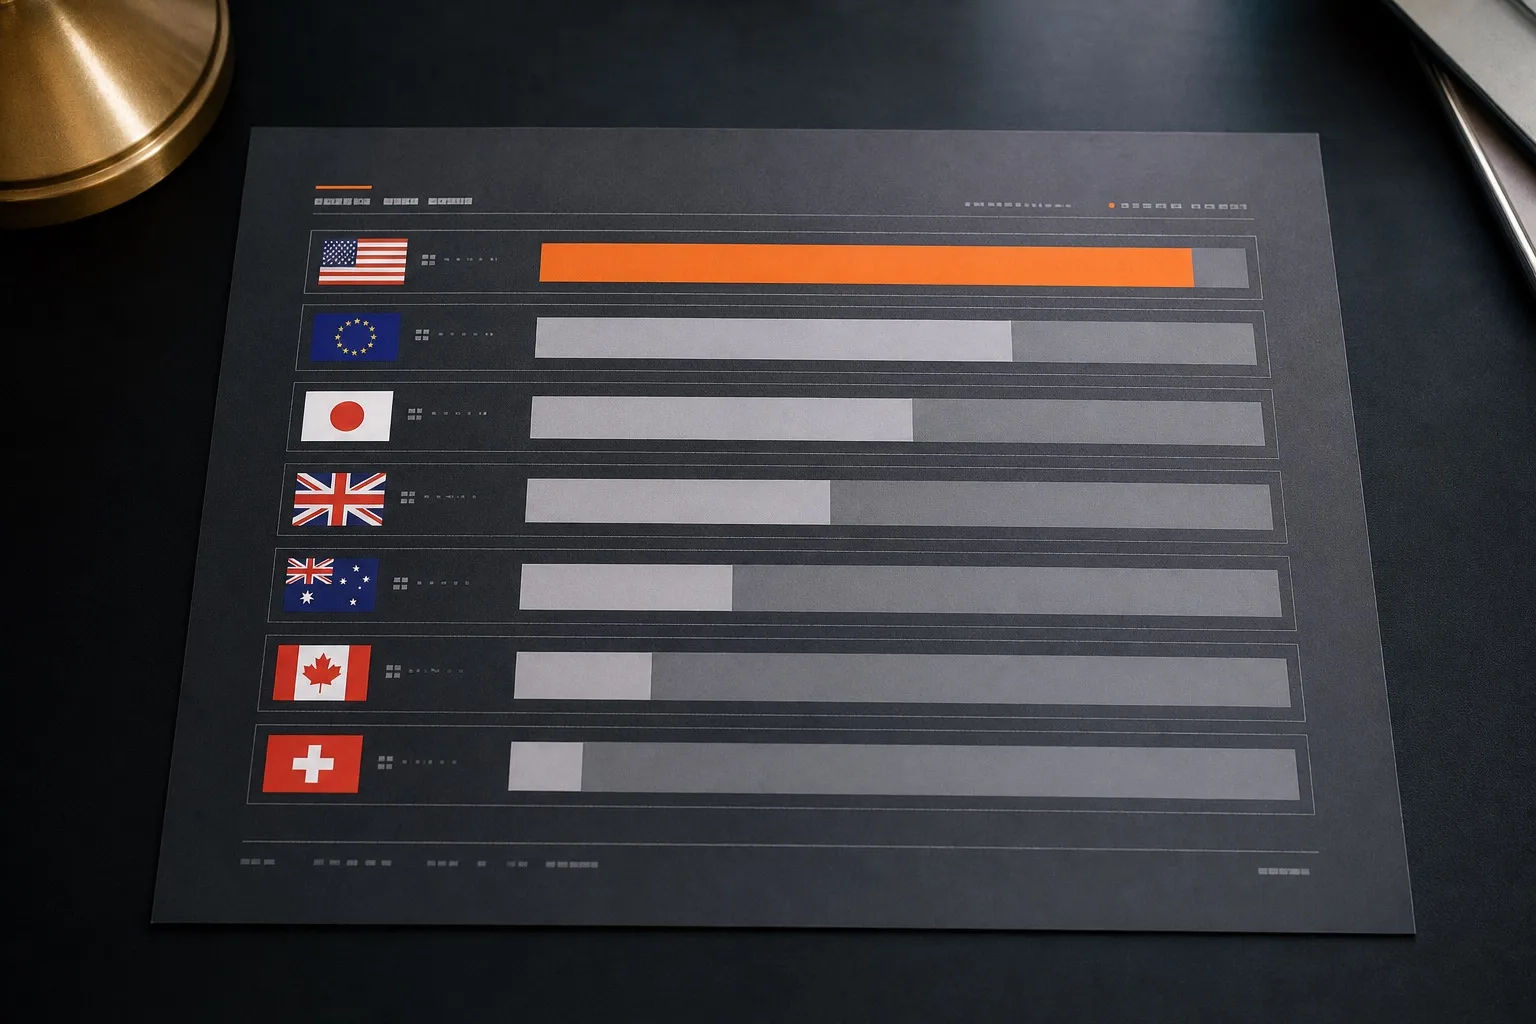
Currency strength expresses the value of one currency against others. For economists, strength is usually discussed in terms of purchasing power; for traders, it is typically a price-based indicator that reflects recent price behavior across a set of pairs [1]. A meter takes the movement of many currency pairs and converts it into one score per currency — commonly the majors: USD, EUR, JPY, GBP, AUD, CAD and CHF.
There are two broad families [1]:
Price-based meters derive strength from market prices, often using a currency index such as the U.S. Dollar Index as their reference.
Fundamental-based meters aggregate macroeconomic inputs — things like ISM manufacturing reports, consumer confidence surveys and interest rate levels — to estimate underlying economic momentum [1].
Most retail "strength meters" you see on broker platforms and charting tools are price-based. They answer a different question than the fundamental kind: not "which economy is stronger?" but "which currency has been moving more in the market lately?"
The anchor most meters borrow from: the U.S. Dollar Index
The best-known currency index is the U.S. Dollar Index (USDX, DXY), designed, maintained and published by Intercontinental Exchange (ICE), which holds the trademark [2]. It measures the dollar against a fixed basket of six currencies as a weighted geometric mean [2]:
Currency | Weight |
|---|---|
Euro (EUR) | 57.6% |
Japanese yen (JPY) | 13.6% |
Pound sterling (GBP) | 11.9% |
Canadian dollar (CAD) | 9.1% |
Swedish krona (SEK) | 4.2% |
Swiss franc (CHF) | 3.6% |
The index dates to March 1973, just after the Bretton Woods system was dismantled, and started at a value of 100.000 [2]. Two details matter for anyone reading strength readings derived from it:
The euro dominates. More than half the index is EUR/USD (inverted). A "dollar strength" reading can therefore be mostly a euro story.
The basket is frozen in the early 1970s. It has been altered only once, when European currencies were absorbed by the euro at the start of 1999 [2]. It does not reflect today's US trading-partner mix — a point commentators have repeatedly raised [2].
The same logic applies to any currency strength meter built from a basket: the weights, not just the prices, shape the reading.
How price-based meters are computed
A typical meter computes, for each currency, the average of its recent percentage moves against a set of counterparties. The sign convention is the part beginners get wrong. A rise in EUR/USD is negative for USD and positive for EUR; a rise in USD/JPY is positive for USD and negative for JPY. The meter flips signs so all six scores point the same way.
Illustrative example (hypothetical session moves, not market data). Suppose over one session: EUR/USD −0.35%, USD/JPY +0.25%, GBP/USD −0.10%, USD/CAD +0.15%, AUD/USD −0.60%, USD/CHF +0.40%. Converting to USD terms gives +0.35, +0.25, +0.10, +0.15, +0.60, +0.40, so a simple equal-weight USD score is about +0.31% for the session. For the euro, only EUR/USD helps directly (+0.35%); its cross moves are approximated by subtracting counterparty moves (e.g. EUR/JPY ≈ −0.35% − 0.25% = −0.60%), giving an EUR score of about −0.12%. These figures are worked arithmetic for demonstration only, not observations of any live session.
Weighting changes the answer too. Applying the USDX-style weighted geometric mean to hypothetical per-currency moves (EUR +0.50%, JPY −0.20%, GBP +0.10%, CAD +0.05%, SEK 0.00%, CHF +0.30%, where a positive number means the dollar strengthened against that currency) yields an index change of roughly +0.29%, versus +0.13% if all six currencies counted equally. The euro's 57.6% weight alone more than doubles the reading. This is why two meters on the same market can disagree: different baskets, different weights, different averaging methods.
Some published indicators formalize this differently. Relative currency strength (RCS) charts a currency's momentum on a scale from 0 to 100 — similar to the Relative Strength Index — based on closing prices, typically over 14 periods, with high and low zones marked at 70 and 30 [3]. Descriptions of the method reference a decorrelation across 28 cross pairs for the selected majors [3].
How to read the display
The usual reading is directional: strong currencies at the top, weak at the bottom, and the widest spreads between them highlighting the pairs with the clearest recent trend. The underlying trading idea is often stated as "buy the strong currency, sell the weak one" — if X/Y is trending, the meter tells you whether the move comes from X's strength or Y's weakness [1][3].
Treat that as a way of framing pairs, not as an entry signal:
A high score is backward-looking: it measures recent moves, not what happens next.
Extreme readings (80/20 on an RSI-style scale) occur less often but indicate stronger momentum, not a reversal or a continuation guarantee [3].
The meter cannot distinguish a genuine trend from a short, news-driven spike that is about to mean-revert.
Limits and pitfalls
Stale or opaque weights. The USDX basket is a documented example of drift: fixed in the 1970s, revised once, and no longer aligned with current trade patterns [2]. Meters that publish no methodology deserve even more caution — you cannot tell what produced the number.
Euro (or index-anchor) dominance. Any USD reading anchored to the USDX is, structurally, more than half an EUR/USD reading [2]. A quiet euro day can mute a genuinely eventful dollar day elsewhere.
No tradable instrument. A strength meter is a derived view. There is no position you can take "in USD strength" at your broker; execution still happens in specific pairs, with their own spreads, swap rates and liquidity. Strength readings do not change those costs.
Correlation distortion. Because every pair shares a leg, the six scores are not independent. A single violent EUR/USD move reshuffles several scores at once, which can make the board look like a broad dollar story when it is one pair's story.
Fundamental meters measure something else. A macro-based meter can stay strong while price momentum fades, and vice versa. Mixing the two families without noticing is a common source of contradictory analysis [1].
A meter is not an endorsement of a trade. Brokers and platform vendors supply these tools; a reading on a meter is not broker research, a recommendation, or evidence of execution quality. Suitability, costs and risk remain your decision — and leveraged forex trading can lose more than many beginners expect.
A short checklist before relying on a meter
Does the vendor document the basket, weights and averaging method? If not, treat the display as indicative only.
Which family is it — price-based or fundamental-based — and are you comparing it against a tool from the other family?
How heavily is the reading weighted toward one anchor currency?
Is the score backward-looking momentum, and does your plan actually require momentum context, or a different input?
Have you checked the specific pair's spread, swap and session timing separately from the meter?
Used that way, a currency strength meter is a legitimate lens: it compresses dozens of relative moves into one comparable picture. It is not an oracle — and knowing exactly how the picture is painted is what separates a useful lens from a misleading one.
Sources
Wikipedia — "Currency strength": https://en.wikipedia.org/wiki/Currency_strength
Wikipedia — "US Dollar Index": https://en.wikipedia.org/wiki/US_Dollar_Index
Wikipedia — "Relative currency strength": https://en.wikipedia.org/wiki/Relative_currency_strength
Sources & further reading
Check the original source for its scope, publication date and latest terms.
- Wikipedia — Currency strengthhttps://en.wikipedia.org/wiki/Currency_strength
- Wikipedia — US Dollar Indexhttps://en.wikipedia.org/wiki/US_Dollar_Index
- Wikipedia — Relative currency strengthhttps://en.wikipedia.org/wiki/Relative_currency_strength
For education and research, not personal investment advice. Trading involves risk. Broker terms and protections depend on your country, account and contracting legal entity.