On this page
The short version
- Volatility is the degree of price variation over time — it says nothing about direction.
- True Range extends the simple high–low range to capture gaps beyond the previous close.
- ATR is Wilder's smoothed average of True Range, conventionally over 14 periods.
- Traders use ATR to place volatility-adjusted stops and to scale position sizes with market noise.
- ATR is a descriptive, lagging measure — treat it as context, not as a trading signal on its own.
Forex prices do not move in a straight line. Some weeks the market barely drifts; other weeks a single session can travel further than the whole previous month. Traders give this degree of movement a name — volatility — and one of the oldest tools for measuring it is the Average True Range, or ATR. This article explains what volatility means in currency trading, how ATR is calculated, and how traders use it for stops and position sizing.
What volatility actually measures
In finance, volatility is the degree of variation of a trading price series over time, usually measured by the standard deviation of logarithmic returns. In plain terms: how widely prices swing around their average path, regardless of which way they end up going.
Two distinctions matter for forex traders:
Historical volatility looks backward. It is computed from a time series of past market prices — the realized swings you can already see on the chart.
Implied volatility looks forward. It is derived from the market price of traded derivatives, particularly options, and reflects what the market expects going forward.
Crucially, volatility is not direction. A market can be extremely volatile while going nowhere (choppy, wide-ranging sessions) or extremely quiet while trending steadily. That is why a separate family of tools — including ATR — exists specifically to gauge the intensity of movement.
The problem with a simple high–low range
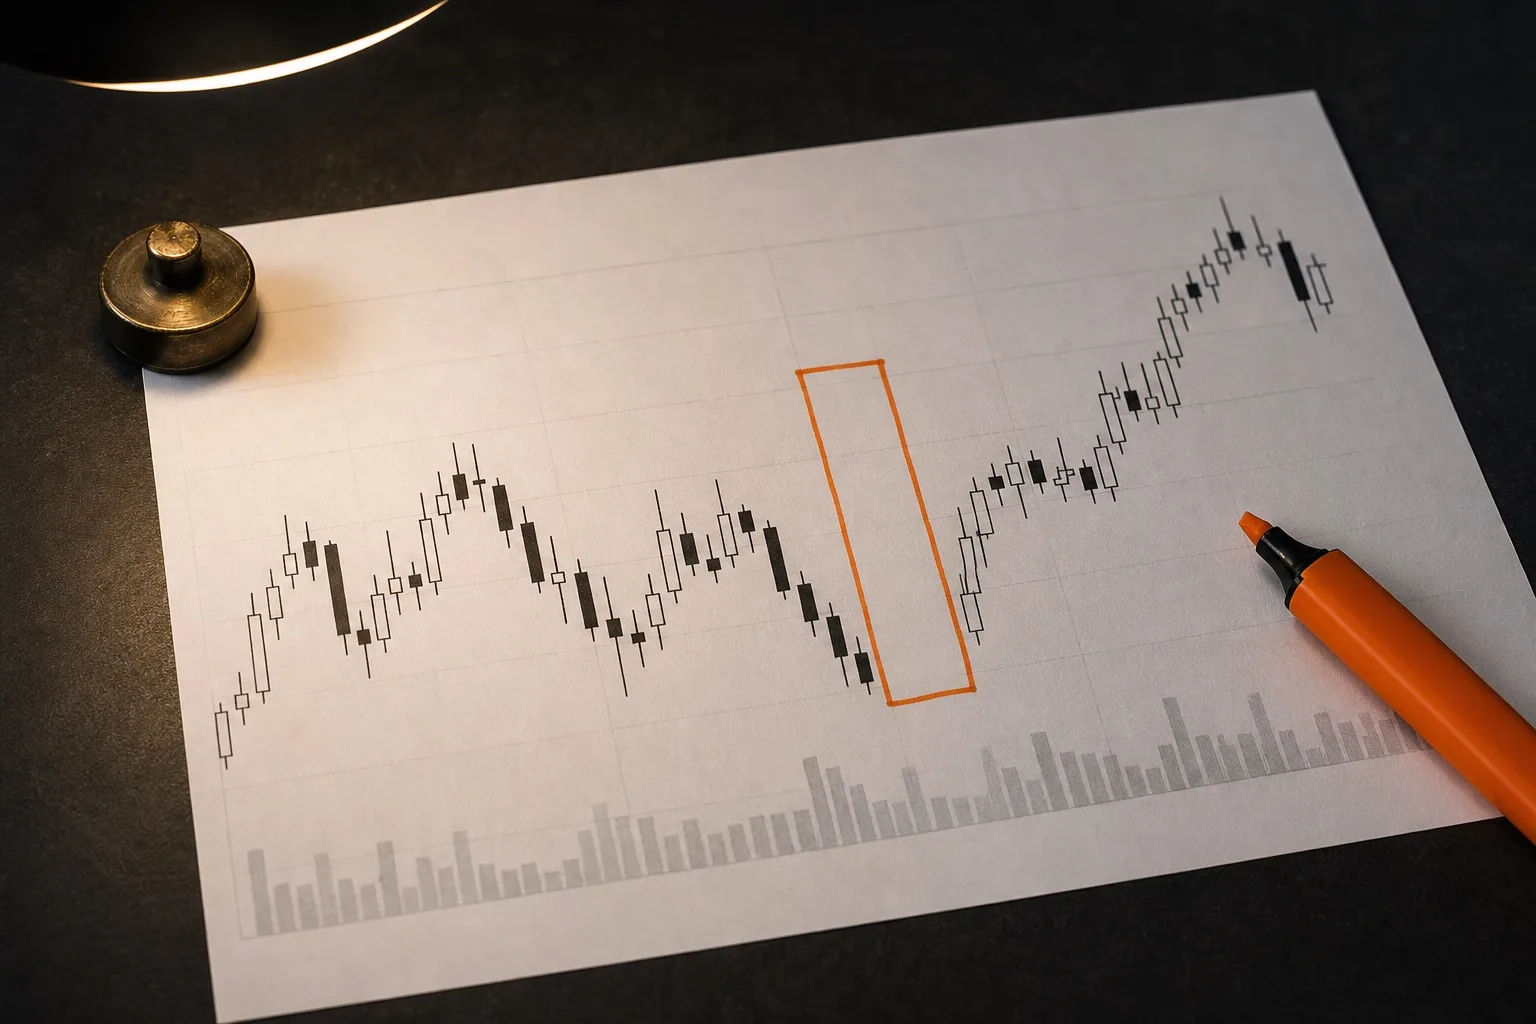
The most intuitive measure of movement in a period is the range: the high minus the low. But a plain range misses one thing that happens regularly in forex: gaps. Currency markets close over weekends, and Monday's open can jump beyond Friday's range. A simple high–low calculation would ignore that entire gap.
J. Welles Wilder, Jr. — the technical analyst who also gave traders the RSI and parabolic SAR — solved this in the 1970s for commodity markets with the concept of the True Range.
True Range: accounting for gaps
The True Range for a period is the largest of three values:
The current period's high minus its low.
The absolute value of the current high minus the previous close.
The absolute value of the current low minus the previous close.
This can be written compactly as: TR = max(high, previous close) − min(low, previous close). When the previous close sits inside the current high–low range, the plain range wins. When price gaps above the old high or below the old low, the distance from the previous close becomes the true range instead.
Worked example (illustrative)
Suppose EUR/USD trades with a high of 1.0850, a low of 1.0800, and the previous day closed at 1.0790. The three candidate values are:
high − low = 1.0850 − 1.0800 = 0.0050 (50 pips)
|high − previous close| = |1.0850 − 1.0790| = 0.0060 (60 pips)
|low − previous close| = |1.0800 − 1.0790| = 0.0010 (10 pips)
The True Range is the largest: 0.0060, or 60 pips — larger than the plain 50-pip range, because the market gapped up past the previous close.
From True Range to ATR
A single period's True Range is noisy. The Average True Range smooths it: ATR is an N-period smoothed moving average (SMMA) of the True Range values. Wilder recommended a 14-period smoothing, and that remains the default on most platforms, including MetaTrader's EUR/USD charts.
The smoothing formula is:
ATR(today) = (ATR(yesterday) × (n − 1) + TR(today)) / n
where n is the number of periods (typically 14). The very first ATR value in a series is seeded with the simple arithmetic mean of the first n True Ranges.
One detail many traders miss: ATR depends heavily on the timeframe. ATR(14) on a 15-minute chart and ATR(14) on a daily chart describe completely different scales of movement. Always interpret ATR in the context of the chart period you are trading.
What ATR tells you — and what it does not
ATR does not provide any indication of price trend. It measures only the degree of price volatility. Reading ATR therefore answers a different question than reading price or momentum indicators:
Rising ATR says swings are getting larger — the market is becoming more active or more uncertain.
Falling ATR says swings are compressing — the market is quieting down, often before a range tightens or a breakout regime begins.
Large or increasing ranges reflect the commitment or enthusiasm of traders: price is being bid up or sold down with force. But ATR alone will never tell you which direction that force is pushing.
Practical use 1: volatility-adjusted stop losses
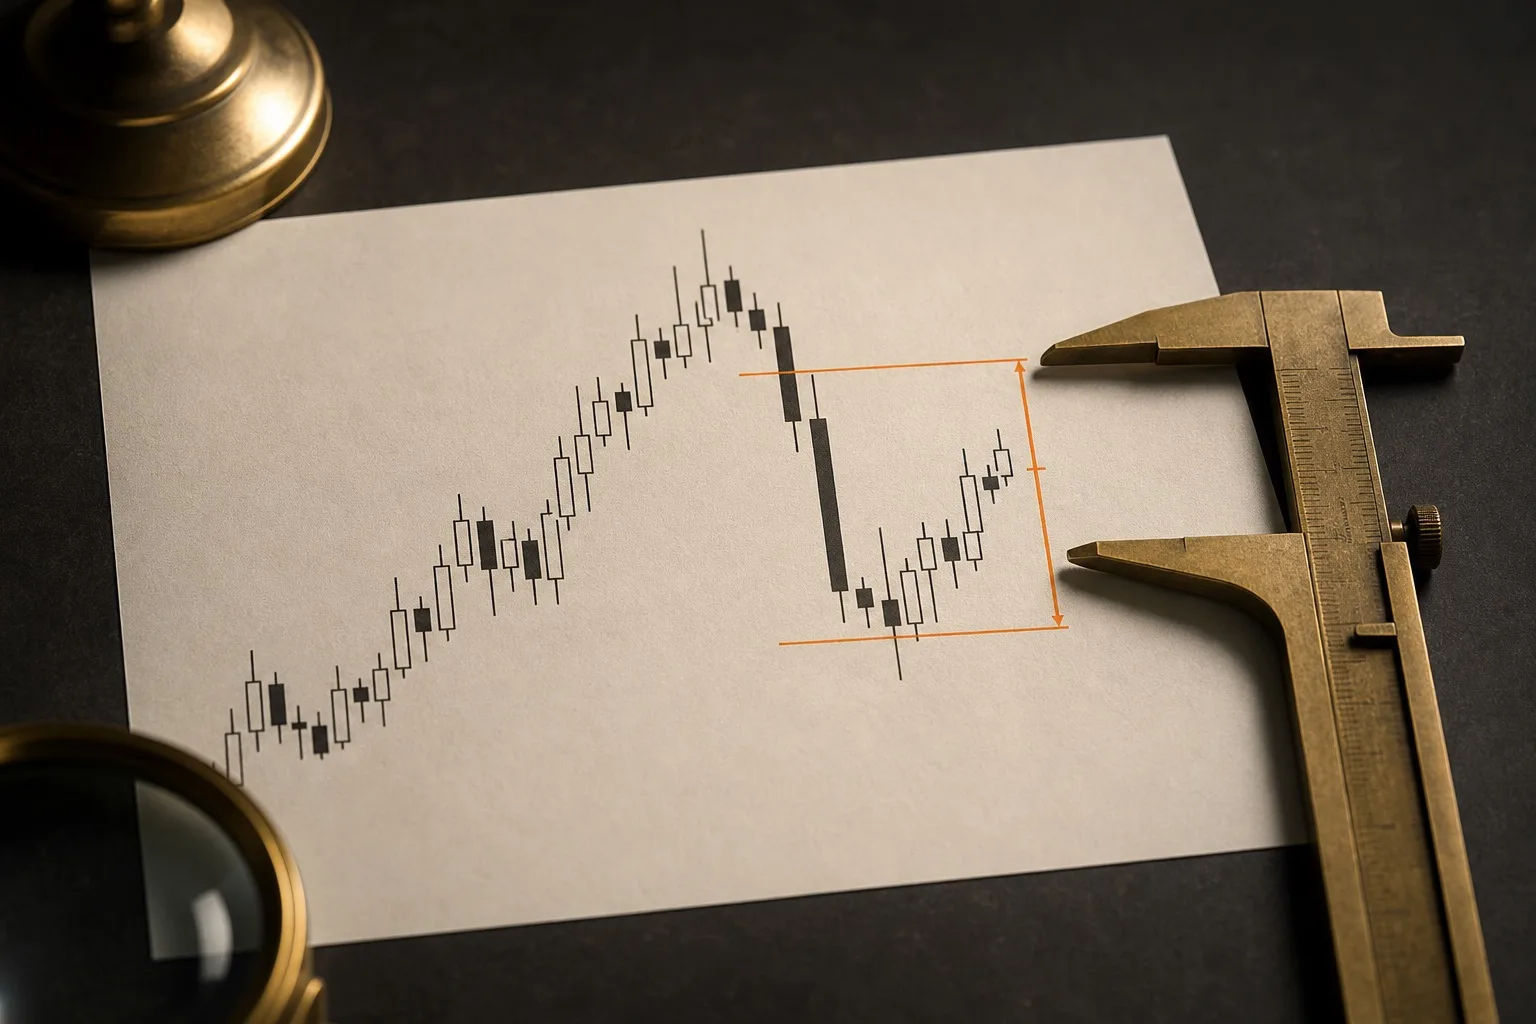
A fixed 20-pip stop may be far too tight on a day when EUR/USD is swinging 80 pips, and needlessly wide on a quiet day. Many traders size stops as a multiple of ATR instead — for example, 1.5 × ATR below the entry for a long trade. The stop then automatically widens in volatile conditions and tightens in quiet ones.
Practical use 2: position sizing
ATR-based stops pair naturally with risk-based position sizing: risk a fixed percentage of the account, divide by the stop distance, and the resulting lot size shrinks automatically when volatility rises.
Worked example: ATR-based sizing (illustrative)
Setup: a $10,000 account, 1% risk per trade, EUR/USD where ATR(14) on the trading timeframe is 50 pips, and a stop placed 1.5 × ATR away.
Stop distance: 1.5 × 50 = 75 pips
Risk budget: 1% of $10,000 = $100
Position size: $100 ÷ (75 pips × $10 per pip per standard lot) = 0.13 standard lots
Now suppose a news event doubles volatility and ATR rises to 100 pips. The stop doubles to 150 pips, and the position size halves to $100 ÷ (150 × $10) = 0.07 lots. The trader risks the same dollars whether the market is calm or violent — which is the entire point.
These figures are illustrative only. Real pip values vary by account currency and pair, and no sizing rule removes the risk of loss.
Caveats every ATR user should know
It lags. ATR is a smoothed average of past ranges. It confirms that volatility already changed; it does not predict the next move.
Regime shifts are abrupt. Central-bank decisions and surprise data can explode ranges well before a 14-period average catches up.
It is not an entry signal. ATR rising or falling says nothing about direction. Pair it with trend, level, or momentum analysis.
Timeframe matters. Compare ATR values only within the same timeframe and instrument.
Key takeaways
Volatility is the degree of price variation over time — it says nothing about direction.
True Range extends the simple high–low range to capture gaps beyond the previous close.
ATR is Wilder's smoothed average of True Range, conventionally over 14 periods.
Traders use ATR to place volatility-adjusted stops and to scale position sizes with market noise.
ATR is a descriptive, lagging measure — treat it as context, not as a trading signal on its own.
Sources & further reading
Check the original source for its scope, publication date and latest terms.
- Wikipedia — Average true rangehttps://en.wikipedia.org/wiki/Average_true_range
- Wikipedia — Volatility (finance)https://en.wikipedia.org/wiki/Volatility_(finance)
For education and research, not personal investment advice. Trading involves risk. Broker terms and protections depend on your country, account and contracting legal entity.